Bitcoin price recently plunged from over $12,000 at the 2020 high to back under $10,000. But after seven straight days of retesting resistance turned support, the crypto asset is already back at $11,000 and climbing.
The bounce on weekly timeframes, just so happened to take place at a specific reading on the Relative Strength Index that throughout Bitcoin’s history has acted as bull market support. If the key level continues to hold, 2021 will be the year of the return of crypto.
Bitcoin Bear Market Could Be Over With This One Line Holding On Weekly Timeframes
Crypto analyst are torn on if Bitcoin’s bull market is here or not. Believers in the stock-to-flow model are certain that now that the halving is in the past, its off to the races and its only a matter of time before prices increase.
Others subscribe to a lengthening cycle theory, that says Bitcoin has a lot more consolidating to do, and could potentially even set new lows from here. Such a scenario would crush any renaming hope in the stock-to-flow model and could prompt an extreme selloff.
Related Reading | These Key Levels And Dates Could Invalidate Bitcoin’s Stock-To-Flow Model
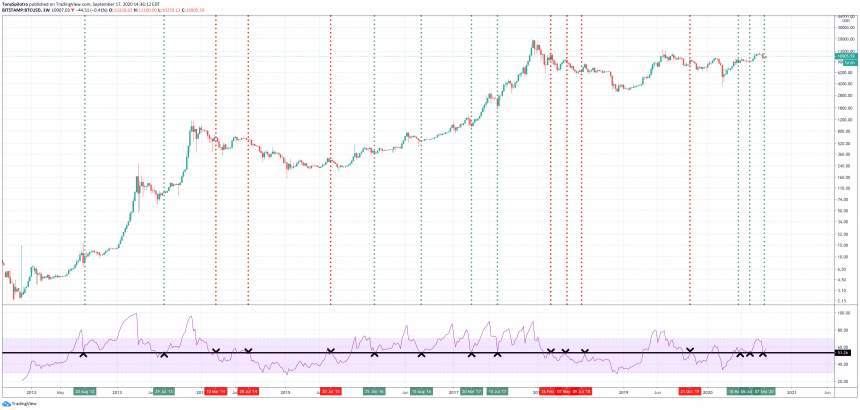
But more and more signals are supporting the idea that a new bull market is beginning. This theory is also being backed up by weekly RSI support on BTCUSD price charts holding up over a reading of 55, just like the asset did during past bull runs.

BTCUSD Weekly Relative Strength Index 55 Support Holding | Source: TradingView
Relative Strength Index Measures Trend Strength, Momentum, Overbought and Oversold Conditions
The Relative Strength Index is a trend-strength and momentum measuring tool. When the tool reaches over 70 or under 30, it signals that an asset is overbought or oversold respectively.
But those aren’t the only meaningful numbers on the RSI. On weekly timeframes in BTCUSD price charts, a reading of 55 on the RSI has had significance throughout all of Bitcoin’s lifecycle.
The line acts as the differentiator between bear and bull markets, and when the top crypto asset holds above that line, it usually means a bull run is on.
Related Reading | Bitcoin Reaches 144 Weeks From All-Time High: Why This Number Matters
Bitcoin price just rebounded hard, directly from that important level on the RSI, and it could mean that the crypto asset has officially confirmed a new bull market.
If history repeats, that line should hold from here on out, no matter how nasty the correction gets. If the line gets lost, however, it could be back to the troughs of the bear market for Bitcoin and the rest of crypto.
Source
